Results - Graph View Tab
The Graph View tab is used to compare the number of service leads of various types, such as appointments or walk-ins.

|
To access the Graph View tab, click the |
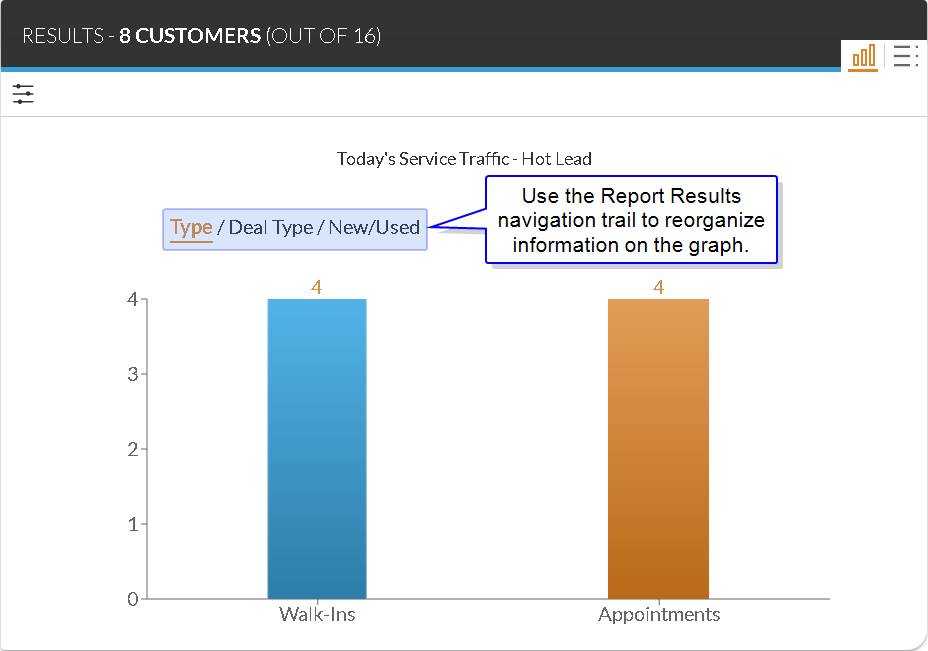
To change how leads are organized on the graph, select an option in the Search Results navigation trail at the top of the section. For example, to display service leads based on whether they are associated with walk-ins or appointments, select the Type option.
To access the List View tab directly from the Graph View tab, click a column to filter the search results based on the selected column. When the last option in the Search Results navigation trail is selected and a column is clicked, the criteria in the Search Criteria panel is updated, and the List View tab displays with customers matching the selected criteria.
The following items are available on the Graph View tab.
Type: Select this data type to view a comparison of service leads generated from appointments and service leads generated from walk-ins.
Deal Type: Select this data type to view a comparison of service leads generated based on deal type, such as Lease or Finance. When this data type is selected, the unlabeled Deal Type section displays in the Results panel. The Deal Type section can be used to select the type of deal, such as current deals or proposed deals.
New/Used: Select this data type to view a comparison of service leads generated based on vehicle type, such as New or Used. When this data type is selected, the unlabeled Deal Type section displays in the Results panel. The Deal Type section can be used to select the type of deal, such as current deals or proposed deals.
Click here for a list of products that may be mentioned in this help file.